Category: Tech & devices

  • Weight-Loss Devices FDA Has Authorized: Balloons, Capsules and More

    Weight-Loss Devices FDA Has Authorized: Balloons, Capsules and More

    In short: The FDA has authorized about a dozen devices for weight loss or weight management since 2001, from a surgically placed band to balloons you swallow and capsules that swell with water in the stomach. In their pivotal trials, people using them lost on average roughly 2 to 9 percentage points more of their body weight than people in the comparison group, over 6 to 12 months. Several are no longer sold, so an FDA authorization does not mean you can get the device today. Checked on October 7, 2026.
    Making food, mess in the kitchen, mess, preparing food, woman, person, human, food, kitchen, cooking, healthy, lifestyle, home, vegetables, happy, preparation, homemade, culinary, cook, chef, smile, s
    Photo: monicore / Pixabay

    This page lists every weight-loss device we could find in the FDA’s databases, with the exact group of people each one is authorized for and whether it is still on the market. For the procedures themselves, see our guides to the gastric balloon, endoscopic sleeve gastroplasty and the Lap-Band, and our side-by-side look at every weight-loss procedure. It is general education, not a recommendation for any device; you and your clinician decide what fits.

    Weight-loss devices at a glance

    • 13weight-loss or weight-management devices we found with an FDA authorization, 2001 to 2026FDA PMA, De Novo and 510(k) databases
    • 8devices on the FDA's own weight-loss device page (current as of March 12, 2026)FDA
    • Feb 20, 2026newest approval: the swallowable Allurion balloon (PMA P250023)FDA PMA database
    • 3authorized devices confirmed off the market (Plenity, Obalon, AspireAssist); 3 more we could not find on sale

    Checked on October 7, 2026

    “Approved”, “cleared” and “granted”: what the FDA words mean

    Devices reach the market by different routes, and the words differ for each. Higher-risk devices, such as balloons that stay in the stomach for months or a band placed in surgery, need premarket approval (PMA), the strictest route, which requires clinical evidence of safety and effectiveness. A new kind of lower-risk device with no earlier example can be granted a De Novo classification, which also sets “special controls” for later devices of the same type. Once a De Novo exists, a similar device can be cleared through a 510(k) by showing it is substantially equivalent to that earlier device. All three are FDA authorizations; none of them is a promise that a device will work for you.

    The FDA’s consumer page splits these products into weight-loss devices (the band, the balloons and the endoscopic suturing device) and weight-management devices (a removable mouthpiece and a swallowed capsule). Its list, last updated on March 12, 2026, names eight products. It does not yet include the Allurion balloon or the Epitomee capsule, both authorized in the database, and it no longer includes several devices that were approved and later left the market.

    Every device we found, with its exact indication

    The table follows the order in which each device works in the body, from the mouth down, not any ranking. “Status” is what we could confirm on October 7, 2026, from company and government sources. All of them are for adults and all are used alongside a diet and activity program; none is a stand-alone fix.

    DeviceTypeFDA route and dateAuthorized for (as written by the FDA)Status, October 2026
    SMART device (Scientific Intake)Removable mouthpiece worn at mealsDe Novo DEN150033, Sept 26, 2016; similar SmartByte cleared 2017 (K171165)Overweight to obese adults, BMI 27-35, with behavioral modification instruction; prescriptionWe could not confirm that it is sold
    Plenity (Gelesis)Swallowed capsule; gel takes up spaceDe Novo DEN180060, Apr 12, 2019; over-the-counter version cleared Jan 19, 2024 (K230133)Adults with BMI 25-40, with diet and exerciseMaker filed for Chapter 7 liquidation on Oct 30, 2023; we found no current US seller
    Epitomee (Epitomee Medical)Swallowed capsule; gel takes up space510(k) K240544, Sept 13, 2024Adults with BMI 25-40, with diet and exercise; prescriptionPre-launch program with selected US clinics
    ORBERA (Boston Scientific)Saline balloon placed by endoscopePMA P140008, Aug 5, 2015Adults with BMI 30-40 who have not succeeded with diet, exercise and behavior programs; up to 6 monthsSold in the US
    Spatz3 (Spatz)Adjustable saline balloon placed by endoscopePMA P190012, Oct 15, 2021Adults with BMI 35-40, or 30-34.9 with a major obesity-related condition, after a supervised weight program; up to 8 monthsMaker lists clinics; US availability not confirmed by us
    Allurion Gastric Balloon SystemSwallowed balloon, no endoscopy; empties and passes on its ownPMA P250023, Feb 20, 2026Adults 22-65 with BMI 30-40 and at least one unsuccessful weight-loss program; up to two balloons over 10 months; “short-term limited weight loss”First US commercial patients treated in April 2026
    Obalon Balloon SystemSwallowed gas-filled balloons, removed by endoscopePMA P160001, Sept 8, 2016Adults with BMI 30-40 who have not lost weight with diet and exercise; removed at 6 monthsNot on sale; ReShape reported no Obalon revenue in 2025 and licensed it out
    TransPyloric Shuttle (BAROnova)Device that sits at the stomach outlet and slows emptyingPMA P180024, Apr 16, 2019Adults with BMI 35-40, or 30-34.9 with an obesity-related conditionWe found no evidence it is sold
    Apollo ESG and Revise systemsEndoscopic suturing to make the stomach smallerDe Novo DEN210045, July 12, 2022Adults with BMI 30-50 who have not lost weight, or kept it off, with more conservative measures (see our ESG guide)In use in the US
    Lap-BandAdjustable band placed in surgeryPMA P000008, June 5, 2001; widened in 2011 to BMI 30-34 with a related conditionOriginally BMI 40+, or 35+ with a severe related conditionSold in the US; approval now held by Medtimo
    Maestro (vBloc) systemImplanted nerve-blocking stimulatorPMA P130019, Jan 14, 2015Adults with BMI 40-45, or 35-39.9 with a related condition, after a supervised programWe found no evidence it is sold
    AspireAssistStomach tube to drain part of a mealPMA P150024, June 14, 2016Adults 22+ with BMI 35-55 who failed non-surgical therapyWithdrawn from the market April 8, 2022
    Not a ranking. FDA PMA, De Novo and 510(k) records read on 2026-10-07. A 13th device, the ReShape Integrated Dual Balloon (PMA P140012, 2015), is no longer on the FDA’s device page and is not covered here.
    Who each device is authorized for: BMI range on the FDA indicationValues in BMI
    Who each device is authorized for: BMI range on the FDA indication
    ItemLowHigh
    SMART mouthpiece27 BMI35 BMI
    Plenity and Epitomee capsules25 BMI40 BMI
    ORBERA, Obalon, Allurion balloons30 BMI40 BMI
    Spatz3 balloon, TransPyloric Shuttle30 BMI40 BMI
    Apollo ESG30 BMI50 BMI
    Maestro (vBloc)35 BMI45 BMI
    AspireAssist35 BMI55 BMI

    Some devices require an obesity-related condition at the lower end of the range (Spatz3, TransPyloric Shuttle, Maestro). The Lap-Band has no upper limit and is left out. Use the BMI calculator to see your own number.

    Source: FDA PMA, De Novo and 510(k) records (checked on October 7, 2026)

    If you are not sure where you fall, our BMI calculator gives your number in a few seconds. A BMI inside a range does not make a device right for you: each label also lists conditions that rule it out, such as past stomach surgery, a large hiatal hernia, pregnancy or certain bowel problems.

    Swallowed capsules: Plenity and Epitomee

    These are the least invasive devices. You swallow a capsule with water before lunch and dinner; inside the stomach, it releases particles or a gel that soak up water and take up space, then pass through and leave the body. Plenity’s hydrogel, made from cellulose and citric acid, can absorb up to 100 times its own weight in water, according to its FDA summary.

    The FDA’s own review is candid about how much they do. In Plenity’s 24-week GLOW trial of 436 adults, people lost 6.4% of their body weight on average, compared with 4.4% on a look-alike capsule filled with cane sugar. The trial missed its own goal of a 3-point difference, and the FDA wrote that the effectiveness was “not appropriate for an indication of weight loss”, which is why both capsules are authorized for weight management. People in the US sites saw a smaller difference than people in Europe. In Epitomee’s 24-week RESET trial of 279 adults at nine US sites, average loss was 6.6% vs 4.6% on placebo, and 55.5% lost at least 5%. Neither trial reported serious device-related side effects. With Plenity, the complaints that did occur were mostly digestive, such as bloating, constipation or infrequent bowel movements; in RESET, digestive side effects were no more common than with placebo.

    Plenity’s story shows why “authorized” and “available” are different things. It was sold by prescription from 2020, and the FDA cleared an over-the-counter version in January 2024, but its maker, Gelesis, had filed for liquidation in October 2023 and its consumer website no longer loads. Epitomee says it is a prescription device and is running a pre-launch program with selected US clinics.

    Gastric balloons: four approved, two still clearly sold

    Balloons take up room in the stomach so you feel full sooner. ORBERA and Spatz3 are filled with saline after a doctor places them through the mouth with an endoscope under sedation, and are removed the same way. Obalon used swallowed capsules filled with gas, removed by endoscope at six months. The newest, the Allurion balloon, is swallowed as a capsule attached to a thin tube, filled with fluid in a roughly 15-minute office visit, and opens a valve on its own so it empties and passes naturally; in its trial it stayed in the stomach for 15.3 weeks on average.

    In the Allurion approval trial, AUDACITY, 550 adults were randomized; those in the balloon group received up to two balloons over 10 months, and everyone had a moderate-intensity lifestyle program. At 48 weeks, weight loss averaged 6.87% vs 3.09% in the lifestyle-only group, and 58.0% of balloon users lost at least 5%. That difference missed the trial’s own 3-point “super-superiority” target under the main analysis, and the FDA approved it for “short-term limited weight loss”. Device-related serious adverse events affected 8 people (3.0%), all after the second balloon; one person had a stomach perforation that the investigators linked to an underlying clotting problem. There were no deaths and no small-bowel obstructions. Our gastric balloon guide has the full ORBERA and Spatz3 trial results and the FDA’s warnings about over-inflation, pancreatitis and deaths with liquid-filled balloons.

    Average weight loss in each device's main FDA trial vs the comparison groupValues in %
    Average weight loss in each device's main FDA trial vs the comparison group
    ItemDeviceComparison group
    Plenity capsule, 24 wk6.4%4.4%
    Epitomee capsule, 24 wk6.6%4.6%
    Obalon balloon, 24 wk6.6%3.4%
    Allurion balloon, 48 wk6.9%3.1%
    ORBERA balloon, 6 mo10.2%3.3%
    TransPyloric Shuttle, 12 mo9.5%2.8%
    AspireAssist, 52 wk12.1%3.6%
    Spatz3 balloon, 32 wk15%3.3%

    Percent of starting body weight. Different trials, people, comparison groups and lengths: not a ranking and not head-to-head. Capsule trials used a placebo or sham capsule; most balloon trials compared with a lifestyle program alone.

    Source: FDA De Novo decision summaries and Summaries of Safety and Effectiveness Data (DEN180060, K240544, P160001, P250023, P140008, P180024, P150024, P190012) (checked on October 7, 2026)

    Two things stand out. First, the comparison group lost weight too, because everyone had diet and activity support, so the useful number is the gap between the bars, not the device bar alone. Second, the devices that stay longer or change the stomach more tend to show bigger gaps, and they also carry more procedure risk. For scale, people in the main trials of today’s leading weight-loss medicines lost about 15% to 21% on average over 68 to 72 weeks, as our comparison of FDA-approved medications shows; that is also a different set of trials.

    The TransPyloric Shuttle and endoscopic sleeve gastroplasty

    The TransPyloric Shuttle was a two-bulb silicone device placed by endoscope that sat at the outlet of the stomach and slowed how fast food left it. In its 12-month trial of 270 randomized adults, weight loss averaged 9.5% vs 2.8% in a supervised diet-and-exercise group, and 66.8% lost at least 5%. It is still on the FDA’s device page, but we found no evidence that it is sold today.

    Endoscopic sleeve gastroplasty (ESG) uses the Apollo suturing system, passed through the mouth, to stitch the stomach into a narrower tube without incisions. The FDA granted it De Novo authorization in July 2022 for adults with a BMI of 30 to 50, and the same decision covers the Revise system used to tighten the connection after an earlier bypass. In the randomized MERIT trial, total weight loss at one year was 13.6% with ESG vs 0.8% with lifestyle changes alone. It is the most common endoscopic weight procedure in the US, with 4,587 cases in 2023 by the ASMBS estimate, compared with 1,461 balloon placements. Our ESG guide covers who it suits and what recovery is like.

    Surgical and implanted devices: the band, vBloc and AspireAssist

    The Lap-Band was the first FDA-approved weight-loss device, in June 2001, and in 2011 the FDA widened it to adults with a BMI of 30 to 34 and an obesity-related condition. It is still sold; the FDA database now lists Medtimo, Inc. as the holder of the approval. Its use has fallen sharply as the sleeve and bypass took over: the ASMBS counted 773 band operations in the US in 2023, down from 55,932 in 2011. Our Lap-Band guide and history of bariatric surgery explain why.

    The Maestro system, also sold as vBloc, is an implanted device that sends electrical pulses to block signals in the vagus nerve between the brain and stomach. In its pivotal trial it was measured by excess weight loss, a different scale from the other devices: 24.4% of excess weight at 12 months vs 15.9% with a sham device. We found no current maker filing that mentions it, and no evidence that it is sold.

    AspireAssist used a tube placed through the abdominal wall into the stomach, so that about 20 to 30 minutes after a meal a person could drain about 30% of the food eaten. In its one-year trial, people lost 12.1% of their body weight vs 3.6% with lifestyle therapy alone. Its maker withdrew it from the market on April 8, 2022, for financial reasons, and said the decision was not related to safety or effectiveness.

    Our history of weight-loss hoaxes shows how old some of those products really are, and our guide to body contouring explains what fat-reduction devices can and cannot do.

    What every device has in common

    Every indication on this page includes a diet, behavior or lifestyle program, and the FDA repeats in its consumer advice that devices alone are not the solution. Results are averages: some people lose much more and some lose little. Most of these devices are temporary, and the balloon summaries show that people tend to regain part of the weight after removal unless the new habits hold; our guide to keeping weight off covers what helps. Medicare does not cover gastric balloons under its national policy, and private coverage for devices varies, so ask about cost before you start; our insurance guide explains how to check.

    If you are thinking about a device

    1. Check the authorizationSearch the exact device name in the FDA database and read who it is indicated for.
    2. Check it is still soldAsk the clinic which device they use and since when; several approved devices are no longer made.
    3. Compare the optionsMedicines, surgery and devices differ a lot in results, risks and cost. Our procedures comparison helps.
    4. Ask about side effectsNausea, vomiting and pain are common early on with balloons; ask what support the clinic gives.
    5. Plan for afterwardAsk what the program includes once the device is removed or passes.

    If you would like to see all your options side by side, including medicines and surgery, start with Find My Options or our hub on weight-loss procedures. To find a specialist, see our guide to finding a bariatric surgeon, many of whom also offer endoscopic treatments.
  • AI Calorie Counting From Photos: How Accurate Is It?

    AI Calorie Counting From Photos: How Accurate Is It?

    In short: AI photo logging is fast, but it is not yet precise. In a 2026 study from the National Institutes of Health, four popular photo-based apps underestimated the calories in carefully prepared meals by about a third, or roughly 250 to 345 calories per meal, and missed about 30 grams of fat. General-purpose AI chatbots were off by about 36% on average for calories in a 2025 study. Photo logging works best for simple, visible foods and worst for mixed dishes, sauces and oils. If you use it, treat the number as a rough estimate, check it against labels or a kitchen scale for foods you eat often, and remember that your daily calorie target (from a tool like our calorie calculator) is an estimate too. Checked on October 7, 2026.

    InstaTuck did not test these apps. This page summarizes published and presented research on how well AI estimates calories from food photos, why it misses, and how to get the most from it. For app features, prices and privacy labels, see our researched list of weight-loss and calorie-tracking apps.

    AI photo calorie estimates in numbers

    Checked on October 7, 2026

    How photo calorie counting works

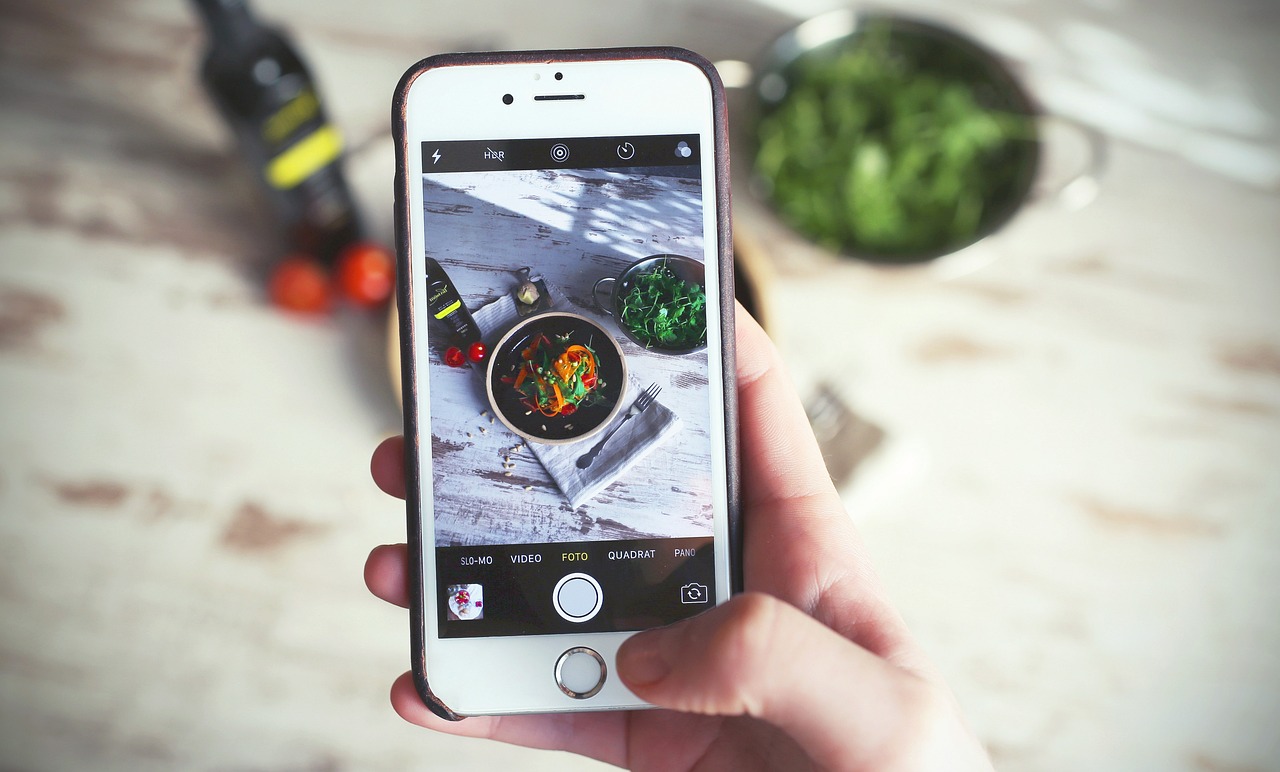
    Most photo-logging features do three things in a row. First, they recognize what is on the plate (a computer-vision step that has become quite good). Second, they estimate how much of each food is there, usually from the image alone, sometimes with a plate or utensil as a size reference. Third, they look up nutrition values in a food database and multiply by the estimated amount. Newer tools also use large language models, the same kind of AI behind chatbots, to describe the meal and estimate nutrients in one step.

    Each step can add error, but research keeps pointing at the second one. A photo is flat, so it cannot show how deep a bowl is, how much oil soaked into vegetables, or what is hidden under a sauce. Two meals that look similar can differ by hundreds of calories because of butter, dressing or cooking oil. That is why fat is the nutrient these tools miss most.

    What the studies found

    Commercial apps vs meals made in a metabolic kitchen (2026). At the American Society for Nutrition’s NUTRITION 2026 meeting in July, researchers from the NIH’s National Institute of Diabetes and Digestive and Kidney Diseases presented a test of four apps with AI photo features: Appediet, Cal AI, Lose It! and MyFitnessPal. They photographed 102 meals prepared in a metabolic kitchen, where every ingredient is weighed and the nutrition is known precisely. All four apps underestimated calories, on average by 252 calories (Appediet), 327 (MyFitnessPal), 333 (Lose It!) and 345 (Cal AI), and underestimated fat by about 30 grams. Carbohydrates were estimated most consistently. Lose It! and MyFitnessPal were more accurate for higher-calorie meals than for lower-calorie ones, and the apps struggled most with low-carbohydrate, high-fat (ketogenic) meals. These are preliminary conference results that had not been published in a peer-reviewed journal when we checked.

    Average calories missed per meal by AI photo features (102 lab-prepared meals)Values in kcal
    Average calories missed per meal by AI photo features (102 lab-prepared meals)
    ItemValue
    Appediet252 kcal
    Cal AI345 kcal
    Lose It!333 kcal
    MyFitnessPal327 kcal

    Alphabetical; not a ranking. Preliminary conference abstract, not yet peer reviewed. All four underestimated; app versions change often.

    Source: NIDDK researchers at NUTRITION 2026, American Society for Nutrition release (July 25, 2026); Healio report (Aug 4, 2026) (checked on October 7, 2026)

    General AI chatbots (2025). A study in Current Developments in Nutrition gave ChatGPT-4o, Claude 3.5 Sonnet and Gemini 1.5 Pro the same 52 standardized food photos, single foods and full meals in small, medium and large portions, with cutlery and plates in view for scale. Compared with weighed reference values, ChatGPT and Claude had an average error of 35.8% for calories and around 36% to 37% for food weight; Gemini’s errors were much larger. All three underestimated more as portions got bigger. The authors concluded these models are not yet suitable for precise dietary assessment, although their accuracy was similar to people’s own self-reports.

    Australian app review (2024). Researchers who screened the top nutrition apps in Australia’s app stores compared AI food-image recognition in seven apps against food records for Western, Asian and recommended diets. They found automatic energy estimates were inaccurate, even though some apps recognized foods well, and that mixed dishes and culturally diverse foods were a particular weakness. Manual logging apps also drifted: they overestimated energy for a Western diet and underestimated it for an Asian one.

    The research as a whole (2023). A systematic review in the Annals of Medicine found 52 studies from 2010 to 2023 that compared fully automated AI estimates from food images with known values. Average calorie errors ranged from 0.10% to 38.3%, depending on the system and the foods, and errors were lower when images showed single or simple foods. The studies differed too much to be pooled. Many of the best results came from research systems tested on curated photo sets, not the apps people download.

    Is AI worse than doing it yourself?

    Not necessarily. People are not very good at estimating food either. In a 1992 study in the New England Journal of Medicine, people who said they could not lose weight despite eating little were found, with precise measurements, to underreport what they ate by 47% on average. In a 2017 study of portion estimation, people’s median error was 23.5% when they guessed food weights with no aid, and 87.7% when they used household measuring cups; a simple size reference cut the error to 18.9%.

    How far off people are when estimating portions (median error)Values in %
    How far off people are when estimating portions (median error)
    ItemValue
    Household measuring cup87.7%
    Modelling-clay cube as a guide44.8%
    Guessing weight, no aid23.5%
    Cube-shaped size reference (IFU)18.9%

    Human estimates, for comparison with AI. A kitchen scale removes most portion error for foods you weigh.

    Source: Bucher T et al., International Journal of Behavioral Nutrition and Physical Activity 2017 (128 adults, 17 foods) (checked on October 7, 2026)

    So the honest comparison is not AI vs perfect, but AI vs the way most of us log food: quickly and imperfectly. The two kinds of error also lean the same way. Both people and photo apps tend to undercount, especially for large, rich meals, which means a food log often shows fewer calories than were eaten. That can make a plateau confusing. Our guide to calorie deficits explains how to adjust when results do not match the numbers.

    Does a 300-calorie miss matter?

    It depends on what you use the number for. U.S. obesity guidelines from the American Heart Association, American College of Cardiology and The Obesity Society describe a typical weight-loss plan as a daily deficit of about 500 to 750 calories. If an app undercounts one meal a day by around 300 calories, as in the NIH test, a plan that looks like a 500-calorie deficit on screen could in reality be closer to 200. Undercount two or three meals and the “deficit” may disappear. That is one reason people sometimes see their weight stall while their log says they are on track.

    For other uses, a rough number is fine. If you mainly want to notice patterns, such as late-night snacking, sugary drinks or how often you eat out, a photo log that is consistently a little low still shows those patterns clearly. And because the error tends to run in the same direction, comparing this week’s log with last week’s is more meaningful than any single day’s total. The simplest check is your own trend: if your weight is not moving after a few weeks, assume the log is low and adjust portions, rather than eating less than a safe minimum.

    Why logging still helps

    Accuracy is only half the story. Self-monitoring, writing down what you eat in any form, is one of the most consistent habits linked to weight loss in behavioral research, according to a 2011 systematic review. In a 2019 study of 142 adults using online food logging, the most successful participants logged in more often, while the time spent per day fell from about 23 minutes in the first month to about 15 minutes by month six. Speed matters because people stop logging when it feels like a chore, and that is the real promise of photo logging: lowering the effort enough that people keep going.

    The trade-off is that a fast, rough log can lull you into trusting a number that is a third too low. The fix is to use photos for convenience and double-check where it counts. If tracking every bite is not for you, structured approaches like intermittent fasting work without counting; our comparison of intermittent fasting vs calorie counting looks at what trials found.

    When photo estimates are most and least reliable

    Usually easier for AIUsually harder for AI
    Single, whole foods (an apple, a boiled egg, a slice of bread)Mixed dishes (stews, casseroles, curries, stir-fries)
    Packaged foods with a visible label or barcodeHidden fats: cooking oil, butter, dressings, sauces
    Foods spread out on a plate, photographed from aboveDeep bowls, stacked or overlapping foods
    Standard portions of common foodsLarge portions and high-fat, low-carb meals
    Foods common in the app’s training dataHome-cooked and culturally diverse dishes
    Patterns reported in the studies above (Annals of Medicine 2023; Nutrients 2024; Current Developments in Nutrition 2025; NIDDK at NUTRITION 2026). Checked 2026-10-07.

    How to get better numbers from a photo app

    Five habits for more accurate photo logging

    1. Edit the guessCheck the foods and portions the app suggests and fix anything wrong, especially oil, butter and sauces.
    2. Weigh your regularsUse a kitchen scale a few times for foods you eat often, then save them as custom entries.
    3. Use labels when you have themScan the barcode for packaged foods instead of photographing them.
    4. Shoot from above, spread outGood light and a top-down view of a plate, not a bowl, help with portion size.
    5. Watch the trend, not the mealCompare your log with your weight trend over two to four weeks and adjust.

    A kitchen scale is the cheapest accuracy upgrade there is; our researched list of kitchen scales explains what features matter. Our macro calculator and TDEE calculator help set targets, and the nutrition hub covers which foods help with fullness. If you follow a low-carb or keto pattern, be extra careful with photo logs, since the NIH study found these high-fat meals were the hardest; see our keto diet guide.

    Privacy: what a food photo can reveal

    Food photos are personal data. Depending on the app, they may be stored on the company’s servers, used to improve its AI, or linked to your account along with weight and health details. Apple’s App Store privacy labels show what each app says it collects and whether it is linked to you; we summarize those labels in our app list. Before uploading photos, check the app’s privacy settings and whether you can delete your images.

    The bottom line

    AI photo logging is a real step forward in convenience, and it will likely keep improving. Today, it is best used as a quick first draft of your food log, not a precise measurement. Combine it with labels, a scale for foods you eat often and an eye on your weight trend, and it can support the habit that matters most: keeping track. For the longer story of how people have tried to manage weight, see our history of weight loss; for other new tracking tools, our explainer on continuous glucose monitors for weight loss; and for keeping results over time, our guide to maintaining weight loss.

  • Continuous Glucose Monitors for Weight Loss Without Diabetes: What the Evidence Says

    Continuous Glucose Monitors for Weight Loss Without Diabetes: What the Evidence Says

    In short: Since 2024, you can buy a continuous glucose monitor (CGM) without a prescription, and many people without diabetes now wear one hoping it will help them lose weight. The evidence so far is thin. Pooled trials in people without diabetes found no significant effect on BMI, and a six-month trial of a diet built around each person’s blood-sugar responses did not beat a standard low-fat diet. A CGM can show how meals, walks and sleep affect your glucose, which some people find motivating, but it does not measure calories or fat. If you have signs of prediabetes or insulin resistance, a lab test and a talk with your clinician come first. Checked on October 7, 2026.

    A doctor discusses coronavirus test results with a patient in a medical office.
    Photo: cottonbro studio / Pexels

    This page explains what over-the-counter CGMs are cleared to do, what normal glucose looks like on one, what the weight-loss research shows and how to get useful information from a sensor if you try one. It is general education, not medical advice, and it does not recommend any device.

    Over-the-counter CGMs at a glance

    • Mar 5, 2024FDA clears the first over-the-counter CGM (Dexcom Stelo)FDA
    • 18+age on the labels, for people not using insulinStelo; Lingo
    • 14-15 dayshow long one sensor lasts (maker-stated)
    • 0large, long-term trials showing CGMs cause weight loss in people without diabetes

    Checked on October 7, 2026

    What a CGM is, and what the FDA cleared

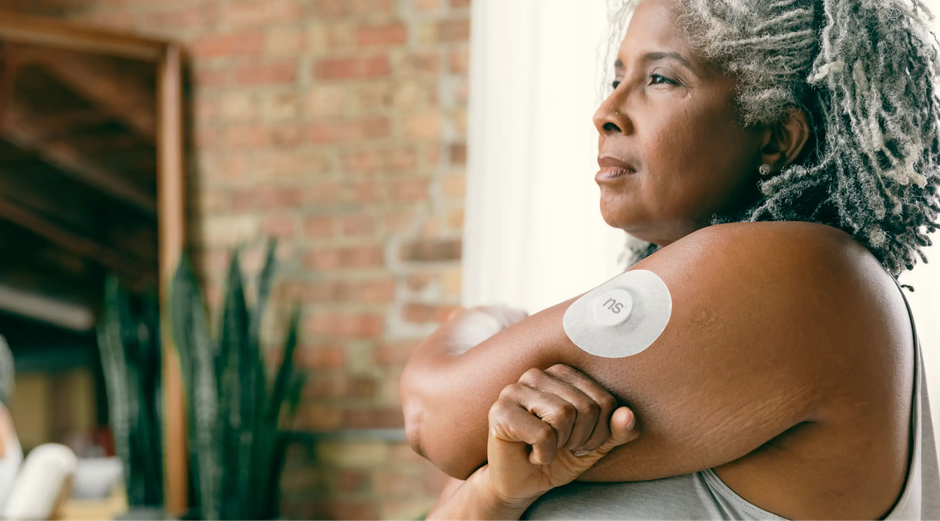
    A CGM is a small sensor worn on the upper arm or belly with a tiny filament under the skin. It measures glucose in the fluid between cells (not in blood directly) every few minutes and sends readings to a phone app. For years, CGMs were prescription devices for people with diabetes, especially those using insulin.

    On March 5, 2024, the FDA cleared the first over-the-counter CGM, Dexcom’s Stelo, for adults 18 and older who do not use insulin, including people with diabetes managed with oral medicines and people without diabetes who want to learn how diet and exercise affect their blood sugar. The FDA said it is not for people with problematic low blood sugar, because it does not alert users to dangerous lows, and that users should not make medical decisions based on it without talking to a health care provider. In June 2024, Abbott announced FDA clearance of two more: Lingo, for consumers 18 and older “looking to improve their overall health and wellness”, and Libre Rio, for adults with type 2 diabetes who do not use insulin. Abbott states that Lingo is “not intended for diagnosis of diseases, including diabetes.”

    As of October 7, 2026, the makers list Stelo at $89 a month by subscription for two 15-day sensors, and Lingo at $54 for a two-week plan with one 14-day sensor (maker-stated prices, checked today; they change). That is roughly $1,000 to $1,400 a year for continuous use.

    What normal glucose looks like on a CGM

    One of the most useful things to know before wearing a CGM is that glucose rises after meals in everyone, and that a rise is not a problem in itself. A 2019 study of 153 healthy, non-pregnant people without diabetes (ages 7 to 80) who wore a blinded CGM for up to 10 days found an average glucose of 98 to 99 mg/dL in most age groups (104 mg/dL over age 60). They spent a median of 96% of the day between 70 and 140 mg/dL, about 30 minutes a day above 140 mg/dL and about 15 minutes a day below 70 mg/dL.

    A typical day for adults and children without diabetes wearing a CGM
    A typical day for adults and children without diabetes wearing a CGM
    ItemValue
    70-140 mg/dL96%
    Above 140 mg/dL2.1%
    Below 70 mg/dL1.1%

    Median share of time in each range. Short spikes above 140 mg/dL are normal after meals.

    Source: Shah VN et al., Journal of Clinical Endocrinology and Metabolism 2019 (153 healthy participants) (checked on October 7, 2026)

    Diagnosis does not use CGM readings. The CDC lists the standard lab cut-offs: an A1C below 5.7% is normal, 5.7% to 6.4% is prediabetes and 6.5% or above is diabetes; a fasting plasma glucose of 99 mg/dL or below is normal, 100 to 125 mg/dL is prediabetes and 126 mg/dL or above is diabetes. If your CGM shows numbers that worry you, those tests, ordered by a clinician, are the way to find out what is going on.

    Lab testNormalPrediabetesDiabetes
    A1CBelow 5.7%5.7% to 6.4%6.5% or above
    Fasting plasma glucose99 mg/dL or below100 to 125 mg/dL126 mg/dL or above
    2-hour oral glucose tolerance test140 mg/dL or below140 to 199 mg/dL200 mg/dL or above
    Source: CDC, Diabetes Testing, checked 2026-10-07. These are lab tests, not CGM readings.

    Where the idea came from

    Interest in CGMs for people without diabetes grew out of research on “personalized nutrition”. In a widely cited 2015 study in the journal Cell, Israeli researchers had 800 people wear glucose monitors for a week and measured their responses to 46,898 meals. Responses to identical meals varied a lot from person to person. The team built a computer model that predicted each person’s response from their blood tests, habits, body measurements, activity and gut bacteria, and in a small trial, diets tailored by that model lowered after-meal glucose.

    Notice what that study measured: blood sugar after meals, not weight. Lower glucose rises are a reasonable goal for people with prediabetes or diabetes, but the step from “steadier glucose” to “more weight loss” is an assumption that has to be tested on its own. Many consumer programs now combine a sensor with an app and coaching and market the package for weight. That is where the research below comes in.

    What the research says about CGMs and weight

    Pooled studies in people without diabetes. A 2026 systematic review and meta-analysis in the European Journal of Medical Research gathered 23 studies with 1,074 participants without diabetes from 11 countries (7 of them randomized trials). CGM use modestly improved average blood glucose compared with controls, but there was no significant difference in BMI. The review found CGM use was linked with better adherence to programs and some specific diet changes, and that glucose benefits showed up in people with prediabetes rather than in healthy people with normal glucose.

    Pooled trials across people with and without diabetes. A 2024 meta-analysis of 25 randomized trials (2,996 participants, mostly with type 2 diabetes) found that CGM-based feedback lowered HbA1c by 0.28 percentage points and increased time in range, with non-significant effects on BMI and weight. Eleven of the 25 studies reported conflicts of interest linked to CGM makers, and only 4 measured diet changes.

    Personalized glucose diets. The idea behind many CGM programs is that people respond differently to the same foods, so a diet that keeps your own glucose steady should work better. The Personal Diet Study tested this in 204 adults with obesity and prediabetes or early type 2 diabetes. For six months, one group got a personalized diet based on a machine-learning prediction of their glucose responses, with color-coded meal scores in an app; the other got a standard low-fat diet. Both had 14 counseling sessions. Weight loss was -3.26% with the personalized diet and -4.31% with the low-fat diet, which was not a significant difference.

    A small positive trial. In a 2026 randomized trial of 35 women with overweight or obesity, all of whom had supervised exercise and the same diet counseling, those who wore a CGM at three points during 12 weeks lost 5.5 kg on average vs 0.2 kg in the comparison group, which wore it only at the start and end. The authors say larger, longer trials are needed. Small, short studies like this can show what is possible, but they often shrink or disappear in bigger trials.

    Personal Diet Study: weight change at 6 monthsValues in %
    Personal Diet Study: weight change at 6 months
    ItemPersonalized glucose-based dietStandard low-fat diet
    Average weight loss3.26%4.31%

    The difference (1.05 percentage points) was not statistically significant. Bars show percent of starting weight lost.

    Source: Popp CJ et al., JAMA Network Open 2022 (Personal Diet Study, 204 adults) (checked on October 7, 2026)

    What a CGM can and can’t tell you

    That last point matters for weight loss. Weight change still comes down to energy balance over time, as our calorie deficit guide explains. A glucose rise tells you how a meal affected your blood sugar, not how many calories it had or how full it kept you. Treating every rise as a problem could steer someone away from fruit, beans or whole grains, foods whose fiber is linked with better long-term health in large reviews. Our list of filling foods and our nutrition hub focus on what helps with hunger and calories.

    There is also the question of accuracy. CGMs read fluid under the skin rather than blood, so readings will not always match a fingerstick test. Abbott’s own instructions for Libre Rio tell users to check with a fingerstick meter when readings do not match how they feel. Some people find the constant numbers stressful. Abbott advises people with a history of eating disorders to talk to a professional before making diet or exercise changes with Lingo, and anyone whose CGM is making them anxious about eating should take that seriously.

    Who might get more out of one

    The research so far suggests the clearest glucose benefits are in people who already have raised blood sugar, such as prediabetes, rather than in people whose glucose is normal. That group should start with a clinician, because a lab diagnosis opens the door to structured prevention programs and to treatment if needed. Our guides to type 2 diabetes and weight and PCOS and weight explain where glucose fits in. People who use insulin need a prescription CGM with low-glucose alerts, not an over-the-counter wellness sensor.

    For people without diabetes, a CGM is best thought of as an optional, short experiment that some find motivating, not a weight-loss treatment. If the cost is a stretch, the habits it tends to encourage, like walking after meals, pairing carbohydrates with protein and fiber, and sleeping enough, are free and backed by broader research. Our guide to metabolism and weight covers what really changes how much energy you burn.

    If you decide to try one

    Getting useful information from a two-week CGM trial

    1. Check you are in the labelOver-the-counter sensors are for adults 18+ not using insulin. If you use insulin or have frequent lows, ask for a prescription device.
    2. Pick one or two questionsFor example, "does a 10-minute walk after dinner change my readings?" rather than tracking everything.
    3. Log meals and activityReadings mean more next to notes on what you ate, how much you moved and how you slept.
    4. Look for patterns, not spikesA single rise after a meal is normal; look at repeated patterns over days.
    5. Share results with a clinicianEspecially readings that seem high when fasting, which may call for a lab test.

    Pair any sensor with the basics that have the strongest evidence: a steady calorie deficit you can live with (our calorie calculator gives a starting point), regular walking and strength work, and an eating pattern you enjoy, such as the Mediterranean diet. If you like data, our fitness tracker picks and smart scale picks cover other self-tracking tools, and our explainer on AI calorie counting from photos looks at another new tracking technology. For the bigger picture of what has changed in weight loss, see 10 innovations that changed weight loss.